Advanced echocardiographic techniques lead to improvements in cardiac assessment of veterinary patients.
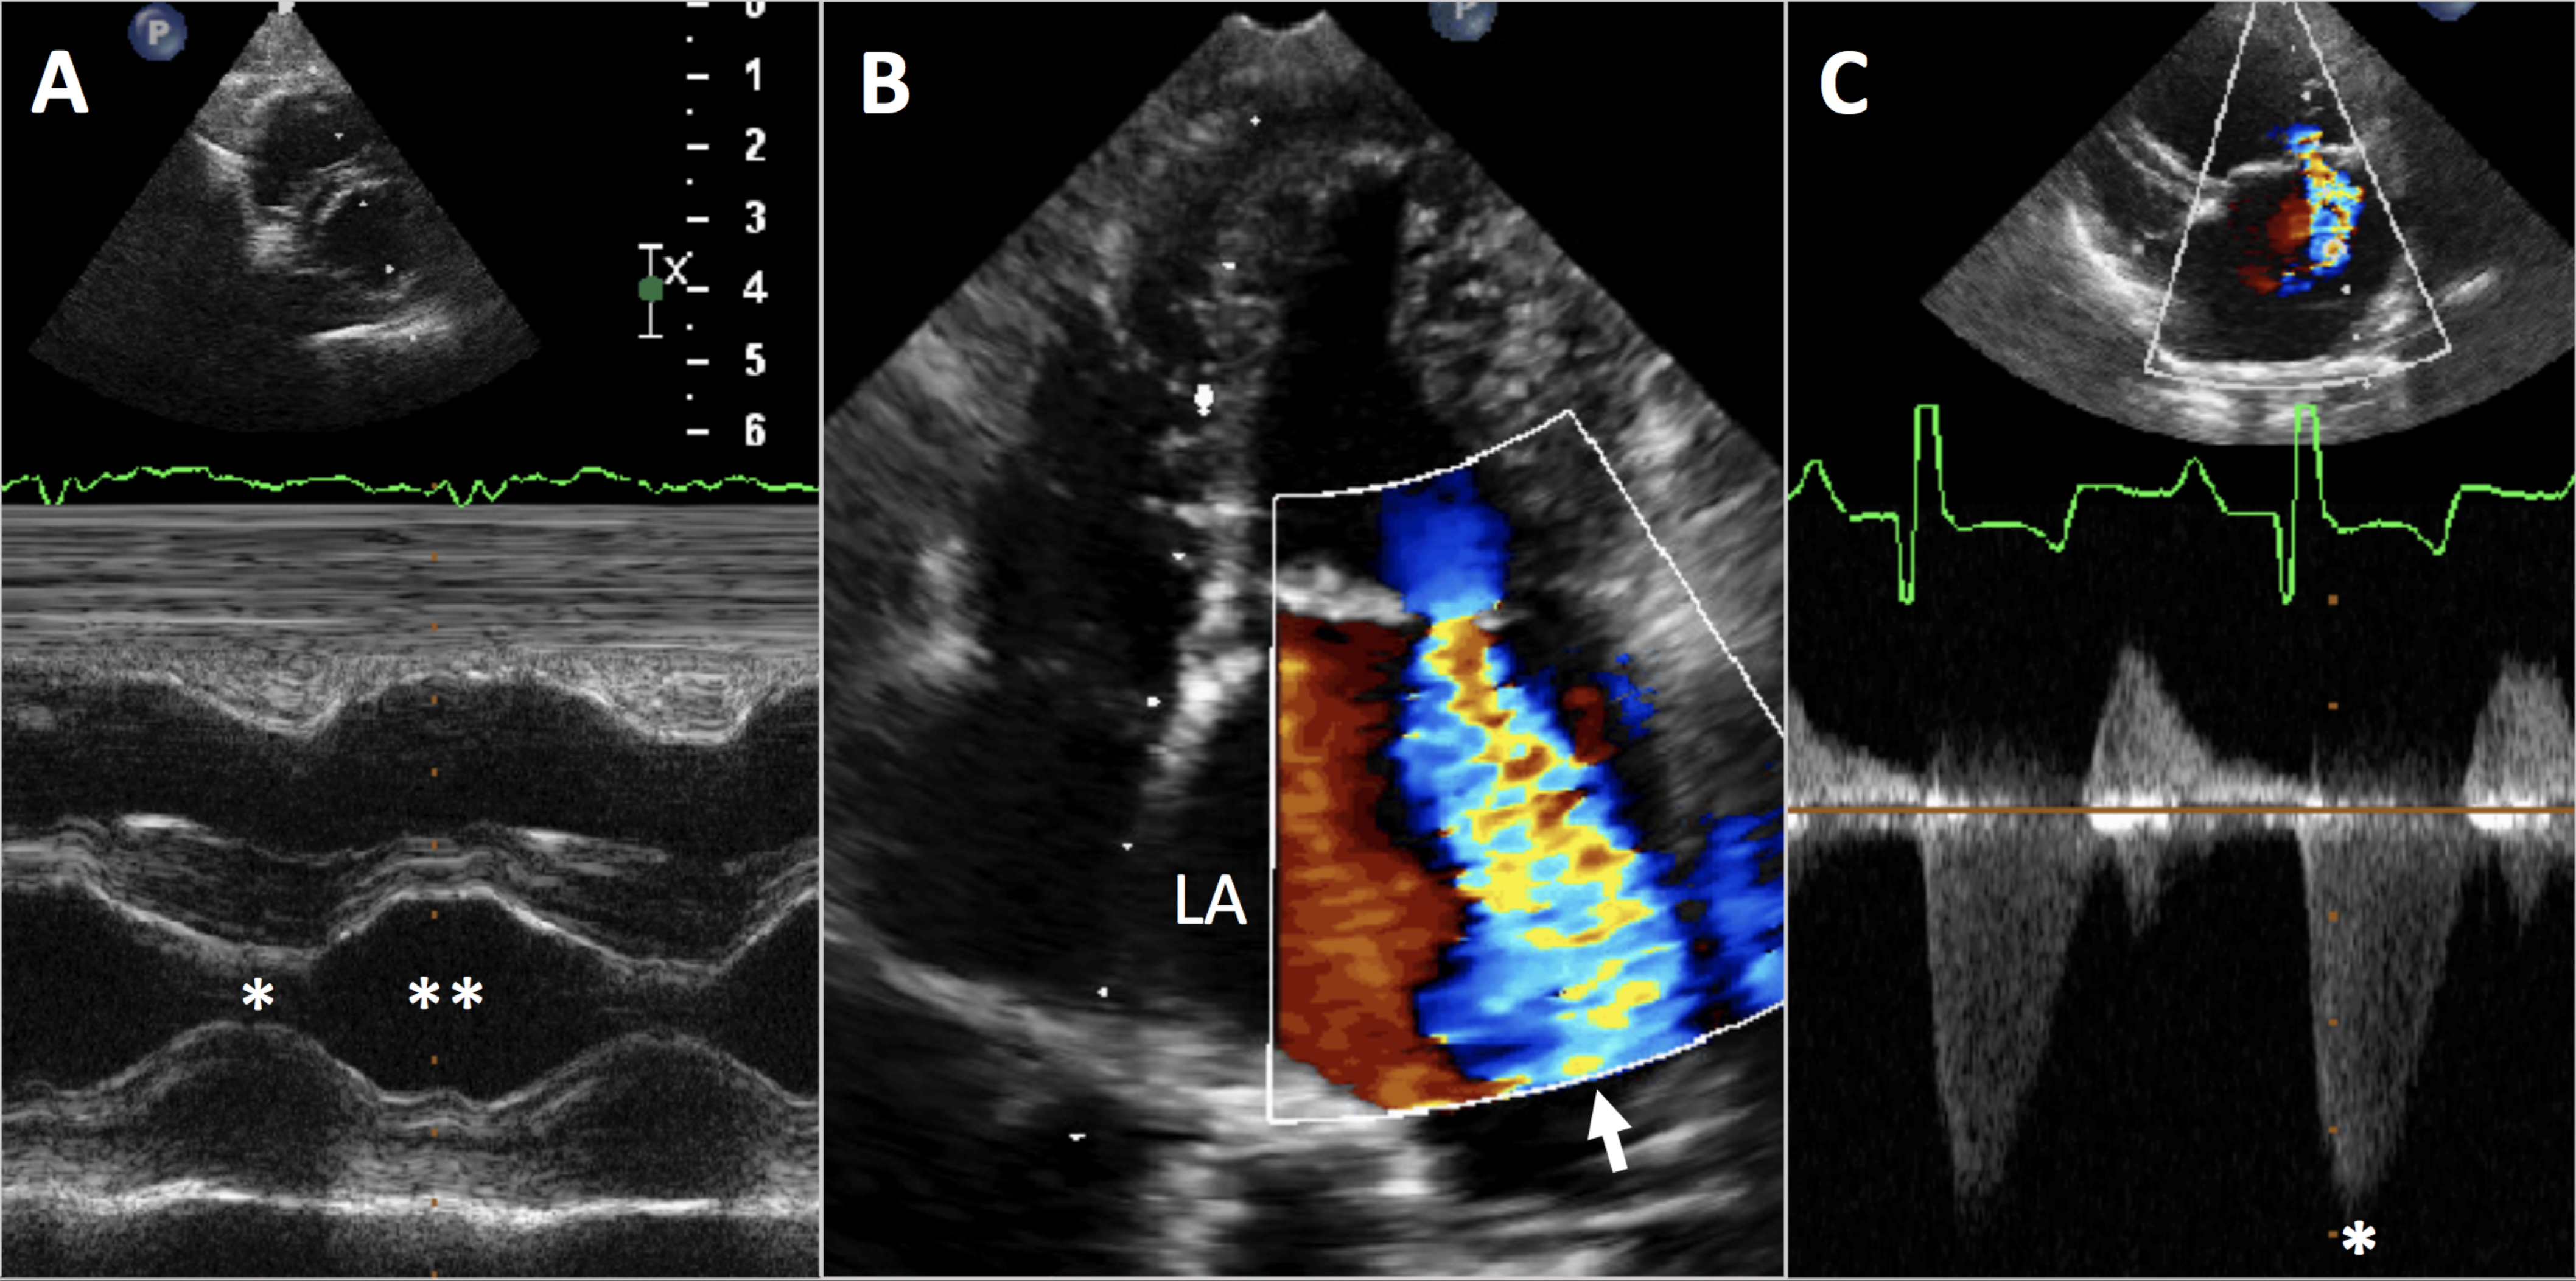
Elements of a standard echocardiogram have historically included: 1) 2 dimensional and M-mode imaging (Fig 1A) of standard views of the heart, primarily for determining size and motion of cardiac structures; 2) color flow Doppler analysis (Fig 1B) for evaluating blood flow patterns; 3) traditional spectral Doppler analysis (Fig 1C), which measures blood flow velocity, and 4) contemporaneous ECG monitoring to accurately characterize timing of on-screen findings relative to the cardiac cycle. All four elements play a role in appropriately assessing heart muscle, chamber and valve function.

Figure 1: (A) M-mode imaging across left ventricle aids in assessment of chamber wall thicknesses and motion during contraction (*) and relaxation (**). (B) Color Doppler assessment across the mitral valve into the left atrium (LA) finds severe mitral regurgitation jet (arrow). (C) Traditional Spectral Doppler trace (*) across mitral regurgitation jet shows speed of blood flow into the left atrium, which can aid with systemic blood pressure estimation. Contemporaneous ECG monitoring (A, C) guides assignment of echocardiographic findings to specific phases of cardiac cycle.
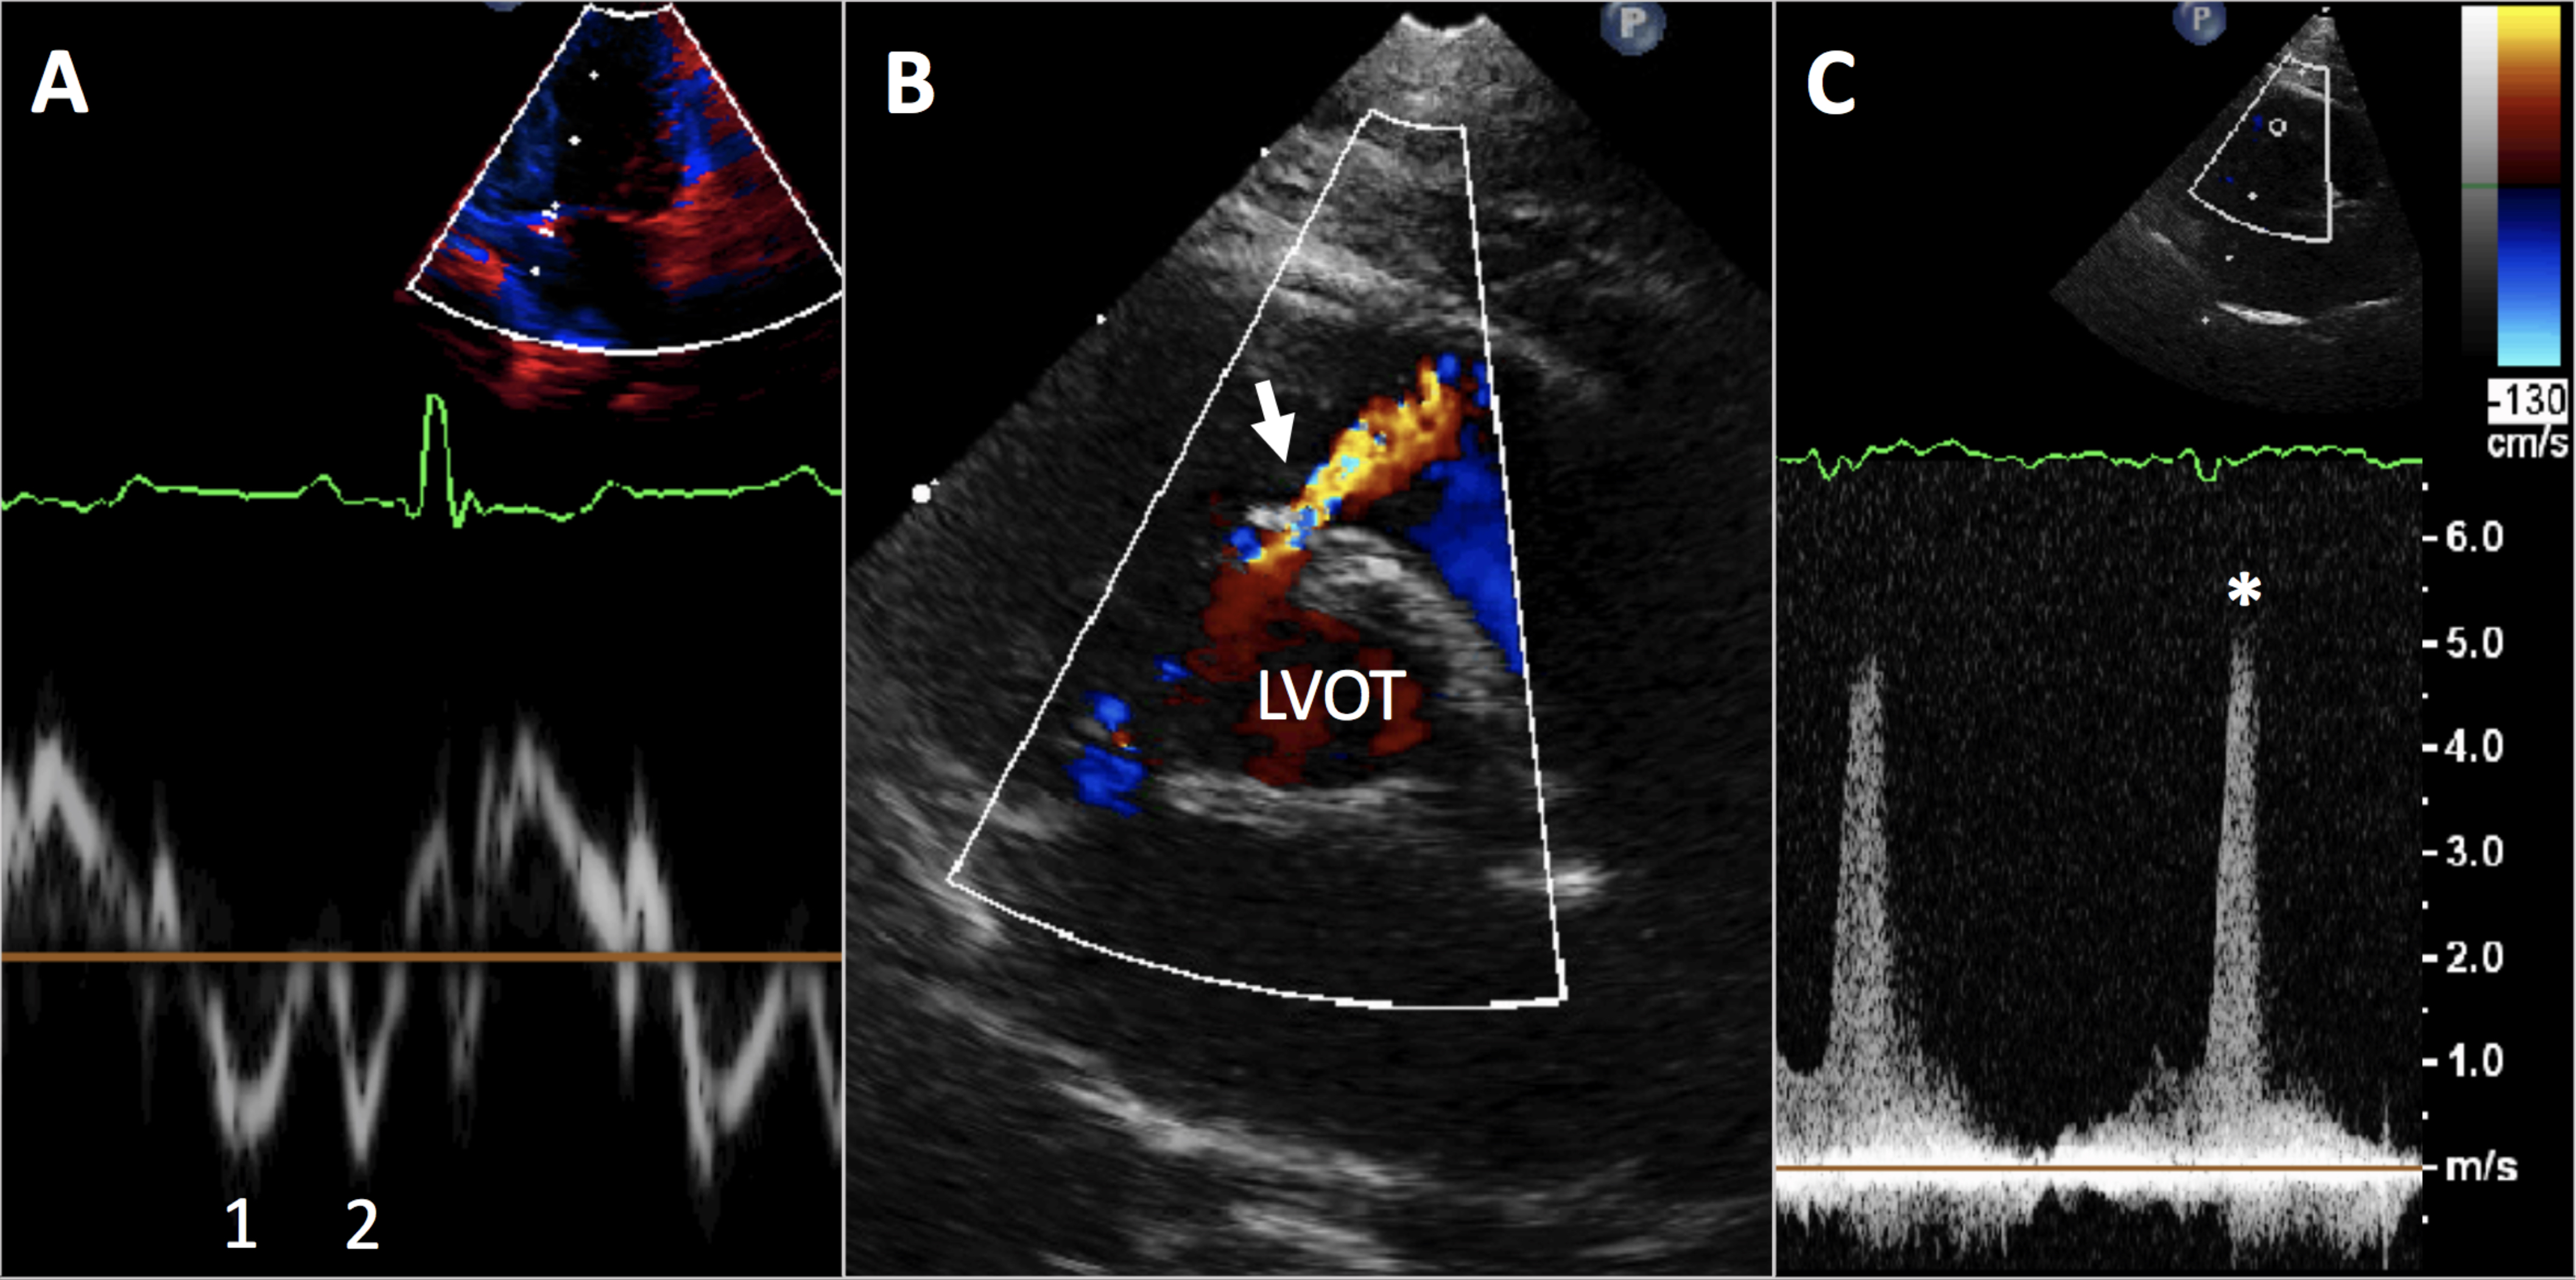
Nowadays, echocardiographic standards have expanded to include advanced Doppler and cardiac timing interval techniques that further aid in diagnosis and management of cardiovascular issues. Tissue Doppler measures speed and direction of cardiac tissue (Fig 2A), highlighting problems with heart chamber relaxation (such as in cats with hypertrophic cardiomyopathy) and contraction (such as with dilated cardiomyopathy). Cardiac timing intervals define phases of cardiac contraction, relaxation, and blood flow. Changes in duration of certain timing intervals, combined with Doppler analysis, can be key in assessing the likelihood of congestive heart failure in some dogs.
These advanced measurements also provide non-invasive methods for diagnosis and quantification of pulmonary hypertension, as well as estimates of systemic blood pressure (Fig 1C). By delivering vital cardiopulmonary information, these advanced echocardiographic techniques are now considered part of a full echocardiograph study, employing spectral Doppler, tissue Doppler, cardiac timing interval, and contemporaneous ECG monitoring capabilities. All components are important in providing the best opportunity to correctly identify and gauge the severity of any cardiovascular disease, including obstructions and shunts (Fig 2B, 2C).

Figure 2: (A) Tissue Doppler assessment of mitral valve annulus shows speed and pattern of annulus motion during systole and diastole. The inverted pattern of the first (1) and second (2) negative spikes below the baseline (spike 1 is less negative than spike 2) suggests impaired left ventricle relaxation. (B) Color Doppler assessment across upper interventricular septum in a cat finds a turbulent color flow Doppler jet (arrow) due to blood flow from the left ventricular outflow tract (LVOT) through a ventricular septal defect. (C) Spectral Doppler waveform (*) assessment of the ventricular septal defect jet finds shunting velocity that suggests a “restrictive” defect with minimal hemodynamic impact.

